Ch 14 - The Levels of Data Modeling
Follow into
Save into
Follow into
This is the final unreleased chapter of Mixed Model Arts, Book 1. It is an agglomeration of various articles on the levels of data modeling published over the last couple of years. Examples have been updated, but the material is mostly what you’ve already seen, just new and very much improved. It’s LONG and I hope you enjoy it!
Also, for paid subscribers, the final book (paperback and e-book) will be published late August or early September. It’s been a long time coming, and the final book is in the hands of my designers. We’ve got some tweaks to make, but it’s almost ready for publication.
Following on the heels of the book launch is an on-demand course for MMA Book 1. Please note that paid subscribers get access to not only MMA 1 e-book + on-demand course (workshops and cohorts are not included), but any other e-books and on-demand courses that I create and publish here (not including my works on O’Reilly, Coursera, Deeplearning.ai, etc).
After MMA 1 ebook + on demand course is launched, expect the price of this Substack to increase. So, lock it in now if you want access to some awesome content.
Thanks,
Joe Reis
Before a fight, the coach scouts the opponent. What kind of fighter are you facing? Pressure fighter, counter-striker, or wrestler? That’s the big picture to identify first. Next comes the game plan: if they pressure forward, circle and counter; if they shoot, sprawl and look for the guillotine. Specific techniques are mapped to specific situations.
Fight night. The round starts, and the plan meets reality—they’re faster than expected, and their left hand is sharper than the tape showed. Three levels are involved: identity, game plan, execution. Data modeling works the same way. And just as the best fighters adapt mid-round when the plan meets reality, the best data modelers revisit and revise their models as the business evolves. We’ll carry this thread throughout the chapter.
For decades, the foundations of data modeling have rested on three levels—Conceptual, Logical, and Physical—a progression from high-level business conversation to the code running in your database. These levels are the heart and soul of intentional data modeling, a disciplined way of thinking that ensures you capture what the business needs to know before you worry about how the computer will store it. As the world races forward with polyglot persistence, event streams, and agents writing and building systems, the risk of semantic conflict—where IT and Business can’t agree on what a “Customer” even means—is higher than ever. Several departments, several incompatible definitions of “Customer.” That’s the most expensive (and arguably the most common) question in data modeling, and we’ll confront it head-on shortly.
These levels are essential tools in a data modeler’s toolkit. First, we’ll define each level’s audience and purpose, then build all three layers for a practical e-commerce scenario. After that, we’ll examine what goes wrong when teams skip these steps, how patterns can accelerate your work, and why the Conceptual Data Model (CDM) remains the most valuable artifact you can create to align business and technical teams. By the end, you’ll have both the theory and the practical instincts to apply these levels in any situation you encounter.
How the Three Levels Fit Together
The three traditional levels of data modeling—Conceptual, Logical, and Physical—represent a clear progression from an abstract business idea to a concrete database implementation. This tiered approach ensures the model is vetted for business understanding and structural integrity before technical constraints are considered or implemented. As you’ll learn, these levels are followed explicitly or implicitly, with varying degrees of rigor and intentionality.
As we move from conceptual to physical, the model shifts from capturing what the business needs to know (the “Big Picture”) to structuring how the data should be organized (the “Blueprint”) and finally to specifying how it will be built and optimized within a specific technology (the “Systems”). We’ll take a conventional look at the levels using structured data examples, since these are the most accessible. Once you have the intuition, it can be easily extended to other forms of data.

Figure 14-1: The progression from Conceptual, Logical, to Physical data modeling
Level 1: Conceptual Data Modeling (CDM)
Conceptual data modeling—which produces the CDM—is the first and highest level of data modeling. At this stage, your goal is to capture the big picture: what fundamental concepts you’re modeling and how they relate to each other. Your job is to listen to “The Business”—domain experts and people in the trenches who understand how things work. Through this, you’ll learn their “language of the business” and identify the core concepts needed to model a domain, subject area, or business process.
Generally, when building the CDM, you first identify entities and how they relate to each other.
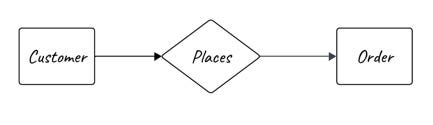
Figure 14-2: Two entities with some sort of relationship
In this diagram, we’re describing the entities using Chen notation, one of the oldest and most intuitive entity-relationship diagram (ERD) notations (we’ll talk more about Chen and the ERD shortly). The rectangles represent entities—the core business concepts or “things” you’re modeling. The diamond in the middle represents a relationship between those entities—the verb that connects them. Lines link entities to relationships, showing that these two concepts are connected. At the conceptual level, this is all you need: entities, relationships, and the connections between them. We’ll get into more detailed notation (like crow’s foot for cardinality) when we move to the logical layer.
My friend and conceptual data modeling wizard, John Giles, calls the CDM a “Town Plan.” I like this analogy. While you could design a town in an ad hoc way (and many older cities resemble “accidental” design over the centuries), you can choose to be intentional. A town plan brings together different ideas for the future—what do you want your community to be?
In much the same way, Giles recommends building a Data Town Plan: “For a city, or a Data Town Plan, you start top-down with the big picture. Too many Enterprise Data Model initiatives get buried in unnecessary, costly detail. Instead, embrace the helicopter views of the business leaders and leave technical details to IT professionals who actually need nuts and bolts particulars.”
What you’re NOT doing yet is worrying about the specific implementation details of the data model. Don’t focus on schema, database tables, or data types. That comes later. For now, your focus is at a high level of abstraction. Gain clarity, structure, and shared understanding with your stakeholders. Here, you’re trying to understand what is and what could be. The Data Town Plan is a CDM that brings business and technical stakeholders together around a shared vision of how the business operates and how that vision is translated into data.
To begin the data modeling process, embrace a seemingly counterintuitive approach that may sound more like a yoga class: slow down, be present, and actively listen. Use low-tech methods to capture initial stakeholder conversations. A simple pen and paper or a whiteboard and markers are sufficient. Whenever possible, record these discussions.
The goal of this initial phase is to foster conversation, not to create the final data model. While you talk with stakeholders, sketch out how concepts relate to one another, and continually ask whether your drawings accurately reflect their understanding. As data modeling expert Larry Burns notes, “The most important thing a data modeler can do is ask questions. Data modeling is not about drawing, it’s about questioning.”
While keeping the visuals low-tech, leverage technology to make recording and transcribing discussions as smooth and friction-free as possible. Always get permission before recording conversations (audio or video). Use voice transcription (ensuring you adhere to any data privacy policies) to generate a written record, which can then be fed into an LLM for summarization and to support subsequent data modeling efforts. Most voice transcription applications can summarize conversations, but you might need something more nuanced to analyze the conversation and identify entities and their relationships.
These conversations are about “learning to see” the business and how processes, information flows, and relationships relate. As Burns further notes, “The data model itself is not as important as the conversations the data model promotes.” The heart of conceptual modeling is discovering what is necessary for the business and how these elements relate to one another.
Graeme Simsion’s book Data Modeling: Theory and Practice[3] highlights an age-old debate over whether data modeling is about describing or designing. Depending on the situation, it can be either—often both over the course of the same data model. When you’re reverse engineering a brownfield system, you’re describing what exists. When you’re building greenfield, you’re designing what should exist. The CDM accommodates both modes. It’s a tool for making the implicit knowledge explicit, whether that knowledge lives in an existing system or in a stakeholder’s head.
The Old Standby: Entity-Relationship Model
To ground the “Town Plan” in reality, it helps to have a way to visualize it. Enter the Entity-Relationship Model (ER).
Back in the 1970s, the data world was a tangle of incompatible file systems and ad hoc data formats, with no shared standards for structuring or querying information. The network, hierarchical, and relational models each had their shortcomings. In 1976, Peter Chen published his seminal paper, “The Entity-Relationship Model—Toward a Unified View of Data.” In the paper, Chen wrote, “The entity-relationship model adopts the more natural view that the real world consists of entities and relationships … The entity-relationship model can be used as a basis for a unified view of data.” Chen was ahead of his time, thinking in a Mixed Model Arts way.
Chen’s breakthrough wasn’t just technical: he also recognized that semantics plays a role in data modeling. He proposed viewing data through the lens of the real world: Entities (the nouns, such as “Customer” or “Order”) and Relationships (the verbs, such as “Places” or “Ships”). His goal was to create a “unified view” that could bridge the gap between how a business person thinks and how a computer stores information.
A brief note on nomenclature. The ER model is the abstract conceptual framework. An ERD is a popular way to visualize an ER model. The ERD uses several notational variations, including specific symbols (boxes, diamonds, lines, and crow’s feet) to represent entities, relationships, and their connections (cardinality). But these are not the same, and are often confused. The ER model is the idea and the rules, and the ERD is the picture of the model used to communicate the idea.
For decades, the ERD (and its variations) has been the standard way to visualize data models. But as we moved into the era of “move fast and break things,” its use was often dismissed as “bureaucratic overhead.” We traded the unified view for a random collection of tables and JSON blobs, widening the communication gap I mentioned earlier. ER modeling and the ERD remain important, and we will use them throughout this book series.
The ERD as the Conceptual “Napkin Sketch”
In this conceptual phase, an ERD doesn’t address data types, nullability, or even primary keys. Think of it as the “napkin sketch” of your conceptual model.
At the conceptual level, the ERD serves three specific purposes:
- Defining the Nouns (Entities): We establish that a “Customer” is a distinct entity from a “Lead” or a “Subscriber.”
- Mapping the Verbs (Relationships): We define the “Social Contract” between data points. Does a “Customer” always have an “Account,” or is the relationship optional?
- Visualizing the Scope: It allows stakeholders to review a single page and say, “Yes, this represents our business,” or “Wait, why is the ‘Warehouse’ missing?”
By using the ERD here, you’re avoiding the “implementation shortcuts” that haunt software developers and data engineers later. You’re forcing the business to agree on semantics before a single line of code is written. If you can’t model it on a whiteboard with a business stakeholder, you certainly shouldn’t model it in your database.
As an aside, John Giles told me he uses Unified Modeling Language (UML) for his data modeling. In the end, pick the tool that works for you.
Level 2: Logical Data Modeling (LDM)
If the CDM is a town plan—an abstract view of how everything fits together—then the logical data model (LDM) is where we begin sketching blueprints for the actual buildings, roads, and so on. The LDM is an intermediate step between conceptual and physical data modeling. You might model entities, relationships, and attributes using the relational model or a star schema for an analytical model. If you’re designing for a document database, your model might favor embedded relationships. The point of logical modeling isn’t to force everything into tables, but to give the domain structure and shape that match its use.
Like the CDM, an LDM is technology- and implementation-agnostic. You’re not choosing storage engines or optimizing queries yet. Instead, you’re taking the ideas from the CDM and shaping them into something any data system can implement, without worrying about the specifics of how it will be implemented.
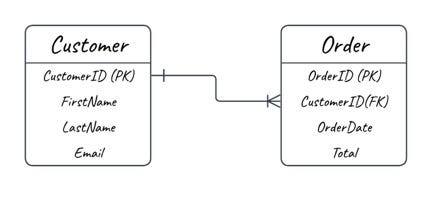
Figure 14-3. A logical data model showing attributes, primary keys, foreign keys, and a one-to-many relationship.